
Oil & Gas Market Information
Oil and Gas Market Overview
2009-2014 – The Rise and Fall of the United States Oil Industry
U.S. Becomes the World’s Largest Oil Producer
By March 2013, U.S. production of liquid fuels had increased to 11.76 MMb/d. The U.S. went on to surpass Saudi Arabia and Russia to become the largest oil producer in 2014. By the end of 2014, the U.S. had nearly doubled its oil production from 2009. Total U.S. crude oil and liquid fuels production hit 13.71 MMb/d in December 2014 and remained roughly the same in 2015, at 13.74 MMb/d. However, in 2016, the total production was forecasted to drop to 12.9 MMb/d. With a record increase of 1.2 MMb/d from 2013, U.S. crude oil production alone rose to 8.7 MMb/d in December 2014 and increased to 9.43 MMb/d in 2015. U.S. production in 2016 was forecasted to be around 9.2 MMb/d. According to U.S. Energy Information Administration, most of the net increase in U.S. crude oil production resulted from improved production of light crude oil in low-permeability/tight resource formations in areas like the Bakken, Permian Basin, and Eagle Ford. (1)
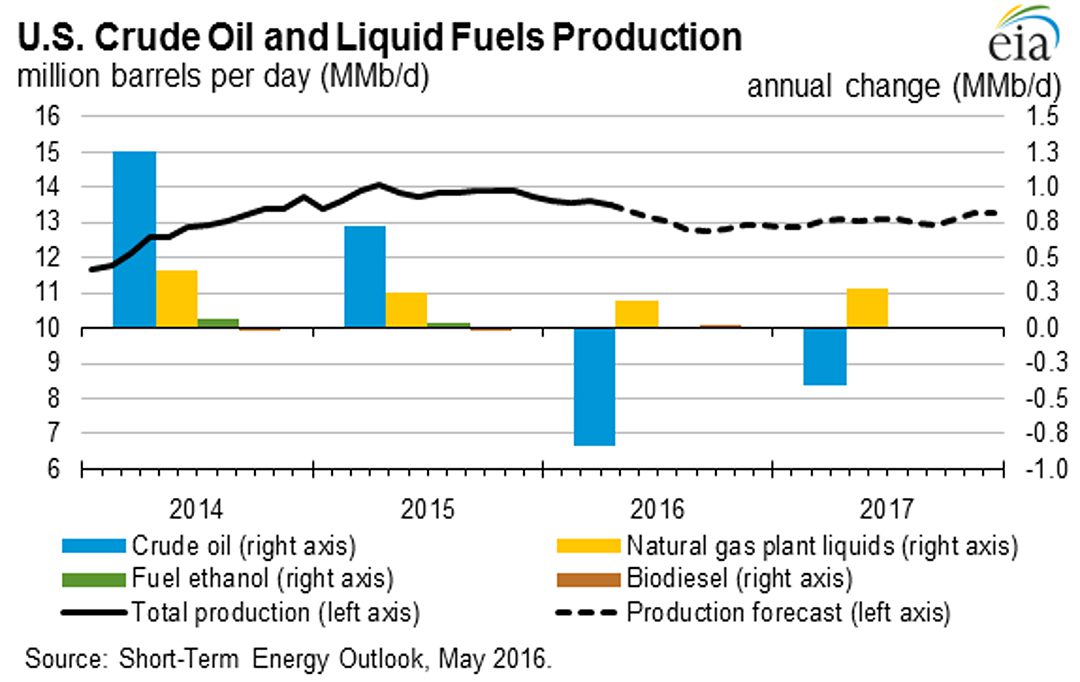
Figure 1
2015-2016 – Creating the Best Time for Acquisitions in Oil and Gas
High Expectations Exacerbate Problems
The Energy Information Agency previously claimed that the mismatch between oil supply and demand was shrinking. The general belief was that prices would stabilize in 2015. Forecasts like these caused a sector-wide reluctance to divest. Though lowered prices created very good opportunities for strategic acquisition, owners believed that prices would turn around, and refused to accept lower valuations. Instead of production decreasing to meet demand and stabilize prices, oil producers continued to drive down prices.
Opportunities in 2016
2016 was a special year for the Oil and Gas industry. In 2016, oil prices dropped to a 13-year low of $26 per barrel, upstream CAPEX fell for the second consecutive year, bankruptcies exceeded Great Recession levels, and OPEC agreed to reduce its 2017 production by about 1.2 MMb/d. However, weak fundamentals failed to dampen M&A activity. Deal count and deal value were both higher than 2015 levels, and the industry witnessed significant mega-deals and sectorial swings. The industry also saw seven deals over $10B in size, the highest at the time.
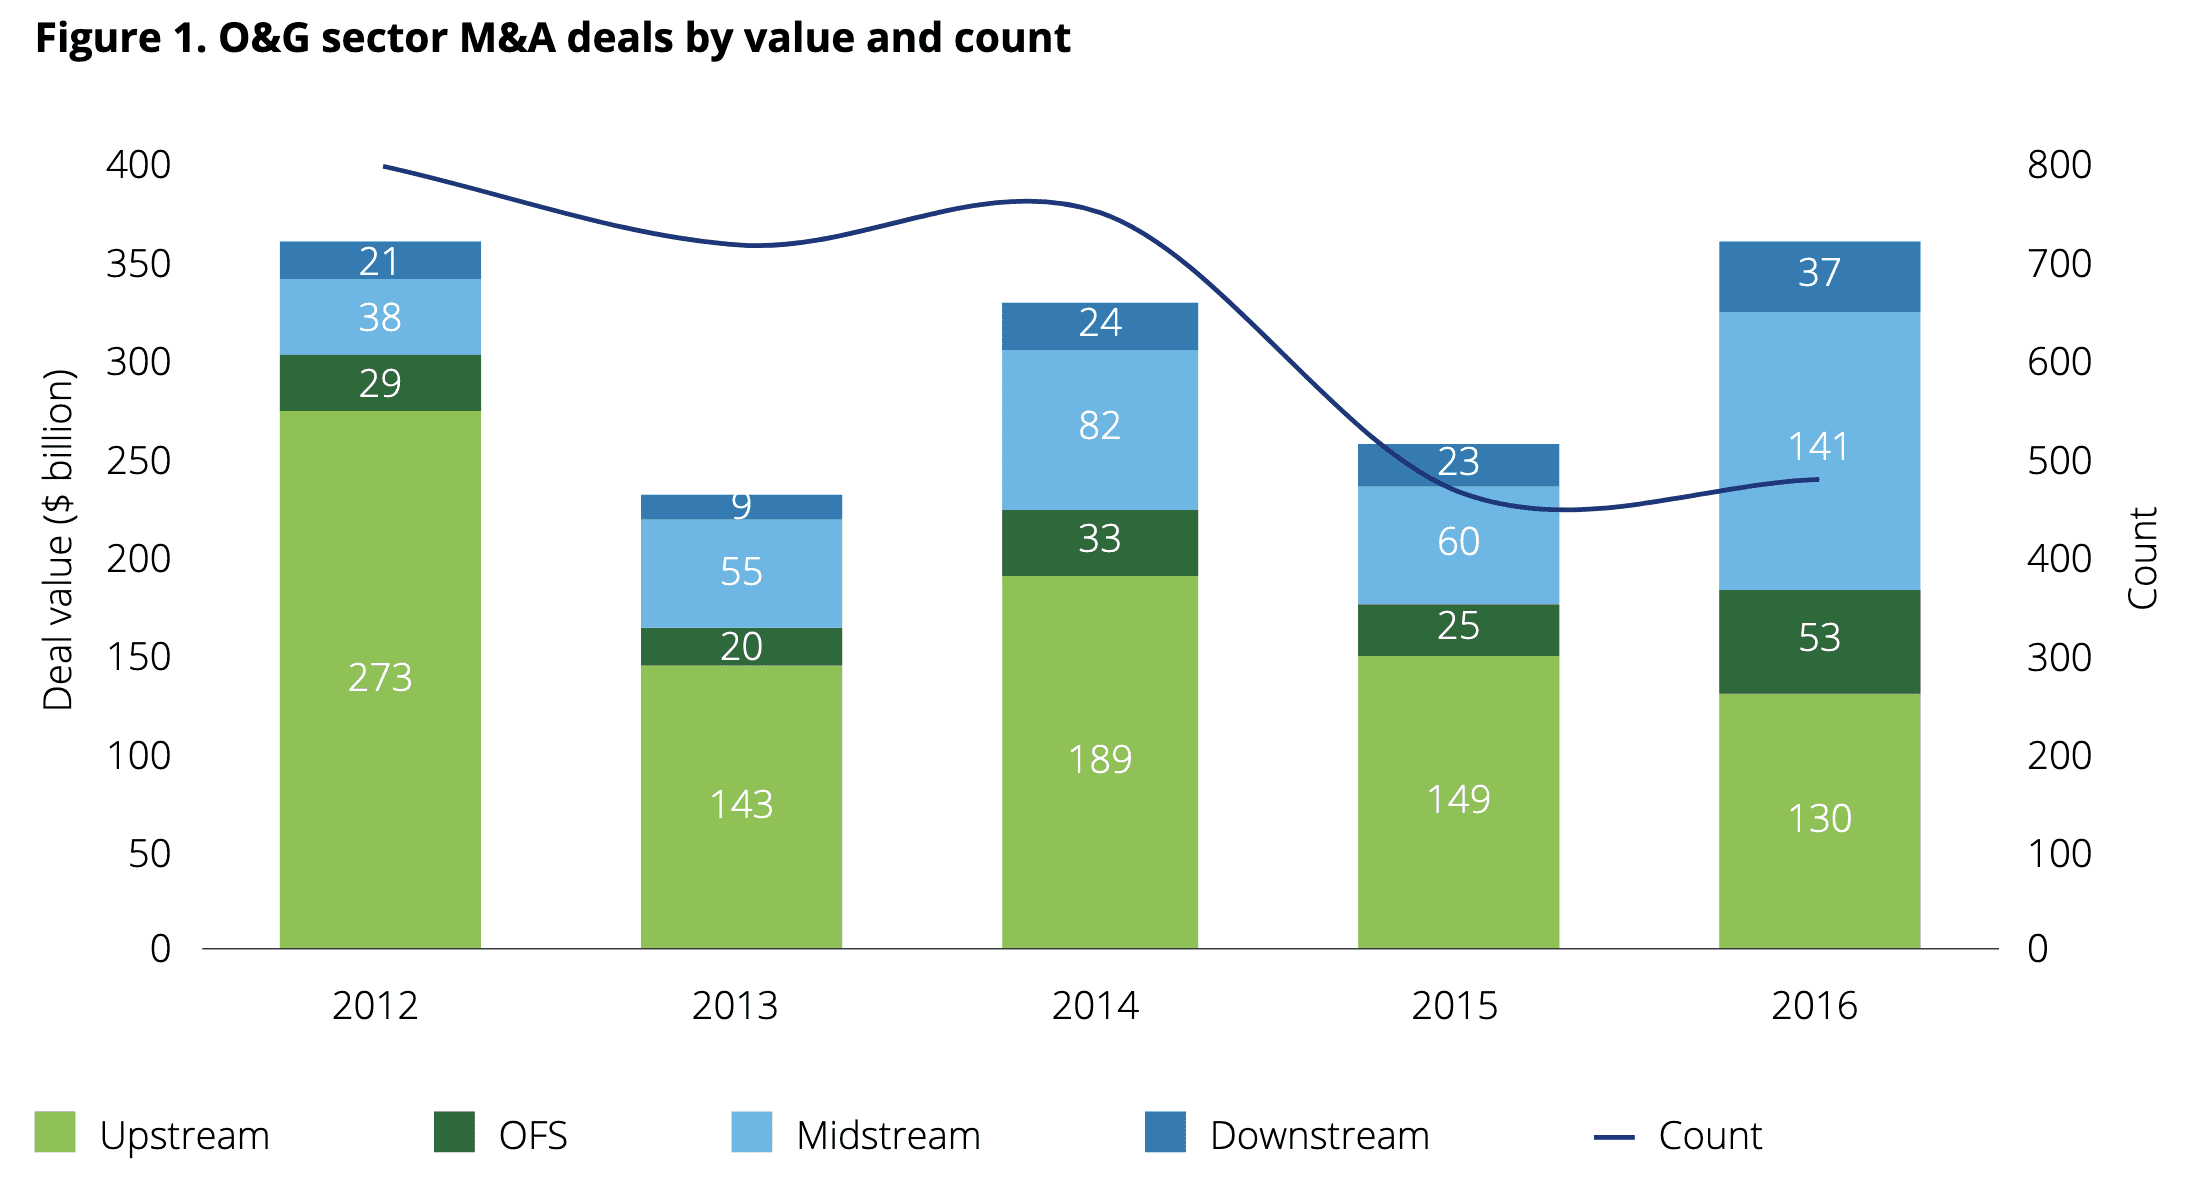
Figure 2
(2)
2017-2019 – Market Overview
In 2017, the United States continued to lessen its reliance on foreign sources of oil and gas, notably those in the Middle East, reducing exposure to foreign political events and pressure. Also, domestic operators were expected to perform strongly as the U.S. produced oil and gas resources meeting domestic and international demand. Revenue rose by 21.3% in 2017, as the Organization of Petroleum Exporting Countries (OPEC) announced an extension of its deal to cut output for an additional nine months, until the first quarter of 2018. As 2018 ended, the oil and gas sector showed recovery from the depths of the post 2014 downturn. In September 2018, oil prices reached $67 per barrel which was a steady increase from 2016. U.S. oil production reached 12 MMb/d in December 2018 and U.S. natural gas gross withdrawals reached 109.4 Bcf/d in December 2018. The recovery occurred due to several factors. One of them was the success of the production restraint agreement between OPEC and non-OPEC countries. Other factors that influenced the recovery of the oil and gas market were the reduced supply from challenged producers while global demand was still high. In 2019, the U.S. oil and gas production reached 12.9 MMb/d and gas production 116.8 Bcf/d, which were both higher than 2018 levels. (3)
2020 and the Future of Oil and Gas in the U.S.
In 2020, the industry went through a unique situation. The combination of a price war between OPEC and Russia, and the economic shutdown due to COVID-19, contributed to a 45% decline in oil prices between January 2020 and May 2020. U.S. oil prices turned negative for the first time on record, after oil producers ran out of space to store the oversupply of crude oil. Oil bankruptcy filings climbed in 2020, with $53.9 billion in debt through the first 11 months, about four times the debt during the same period in 2019. Most of the filings were from shale firms, and the pace has picked up in 2021. The West Texas Intermediate (WTI) crude oil prices averaged about $2.7 per barrel less than Brent prices in 2021, and are forecasted by EIA to be $3.6 per barrel less in 2022. EIA reported Brent crude oil prices to average over $70 per barrel in both 2021 and 2022 compared to an average of $41 per barrel in 2020. U.S. regular gasoline retail prices averaged $2.18 per gallon in 2020, down from an average of $2.60 in 2019. EIA forecasts gasoline prices to average $3.06 per gallon in 2022 similarly to 2021. (4)
Future Global Oil Demand
The global consumption of petroleum and liquid fuels increased in 2021 by 5.44% with an average consumption of 96.9 MMb/d. The average consumption in 2020 was 91.9 MMb/d. EIA expects that the global liquid fuel consumption will continue to increase in 2022 by 3.6 million MMb/d and in 2023 by 1.8 million MMb/d, surpassing more than 100 MMb/d in 2023.
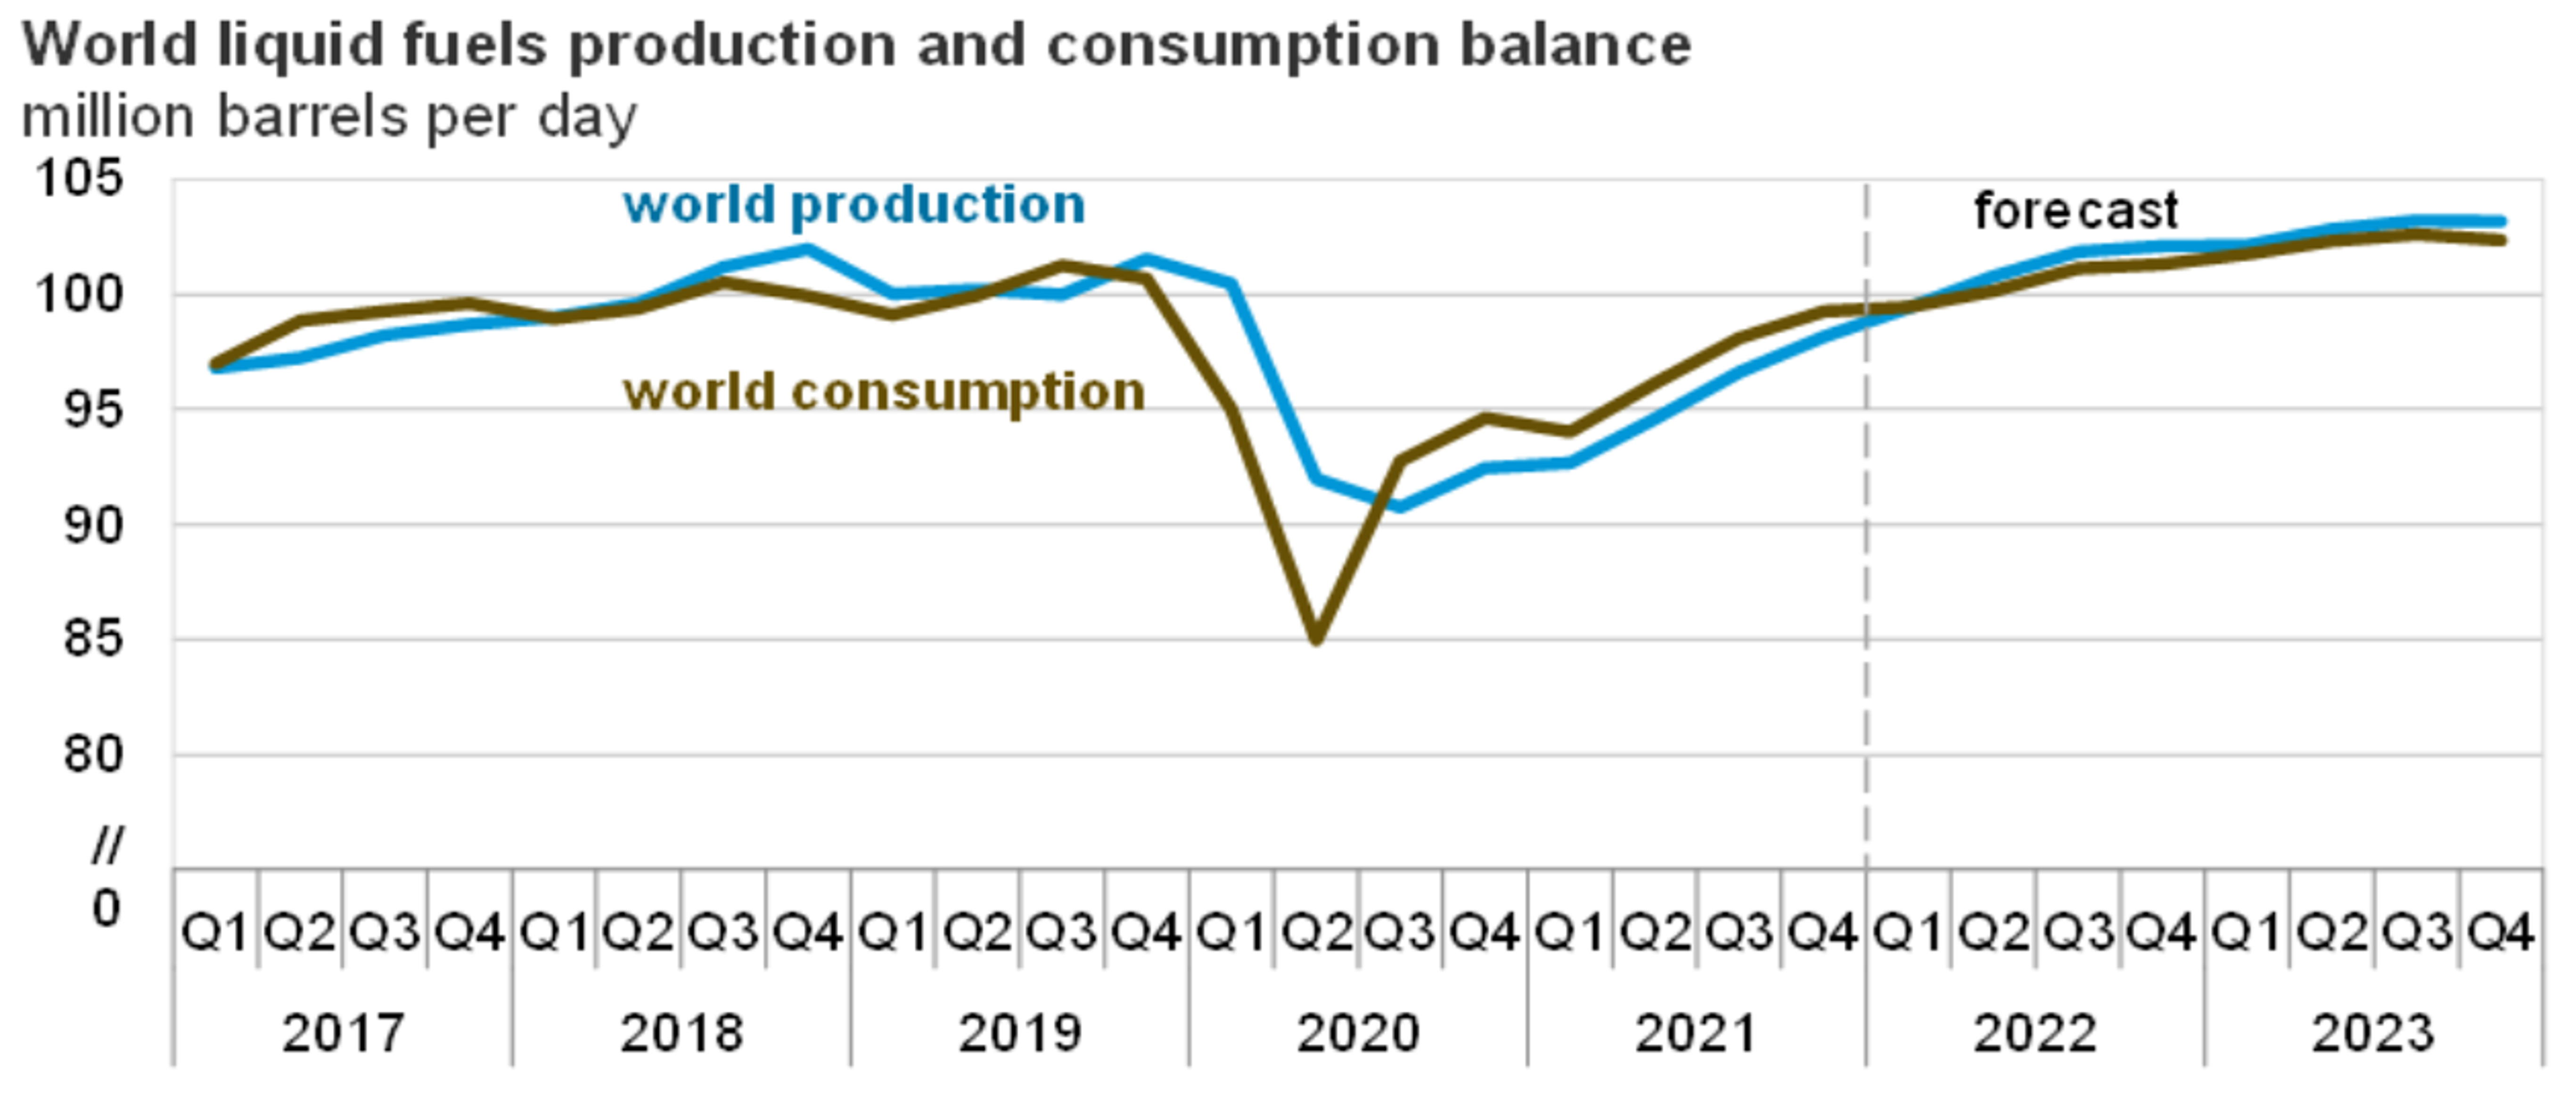
Figure 3
(5)
Favorable Legal Framework
Private Ownership Opportunity
In the United States, mineral rights to oil and gas assets are often owned by private parties, and not solely by the government. This differs from most other countries, allowing individuals to directly participate in oil and gas asset investments. The United States provides a stable legal and political environment, which favors safer investments in oil and gas compared to other countries, as well as regulatory commissions to protect operator and investor ownership of oil and gas assets.
Attractive Investment Structure
Operators typically set up limited partnerships (LP) or joint operating agreements (JOA), which provide attractive tax benefits, provide majority control to investors, and free investors from personal liability. (6)
Most Attractive Tax Advantages
First Year Intangible Drilling Costs
In oil or gas partnerships, investing general partners qualify for tax write-offs for up to 100% of what are considered “intangible” drilling costs. These represent the cost of drilling the wells (see Internal Revenue Code section 263 (c)). The actual tax write-off percentage will vary, but the deductible percentage is usually around 85% of the investment. Certain types of limited partnerships will not qualify for this accelerated deduction.
Lease Operating Expenses
Once a well starts producing, a general partner’s share of expenses related to the well’s production can also be deducted. These include severance taxes and most other expenses from the producing well.
Completion and Equipping Costs
Well-head equipment, such as pump jacks, storage tanks, and additional equipment, can be depreciated over a 7-year period. (7)
Depletion Write-Off
The estimated reserves for a well are written off using 15% depletion. Depletion is calculated using the dollar amount of oil produced from the well based on Internal Revenue Code section 613. (8)