
Consumer Products Market Information
Consumer Products
Food & Beverage: Continuing Health Consciousness Reshapes the Industry
Revenue in the U.S. Retail Food & Beverage segment is projected to reach $738 billion in 2022.
Revenue is expected to show a compound annual growth rate (CAGR 2021-2025) of 5%, resulting in a projected market volume of $832 billion by 2025.
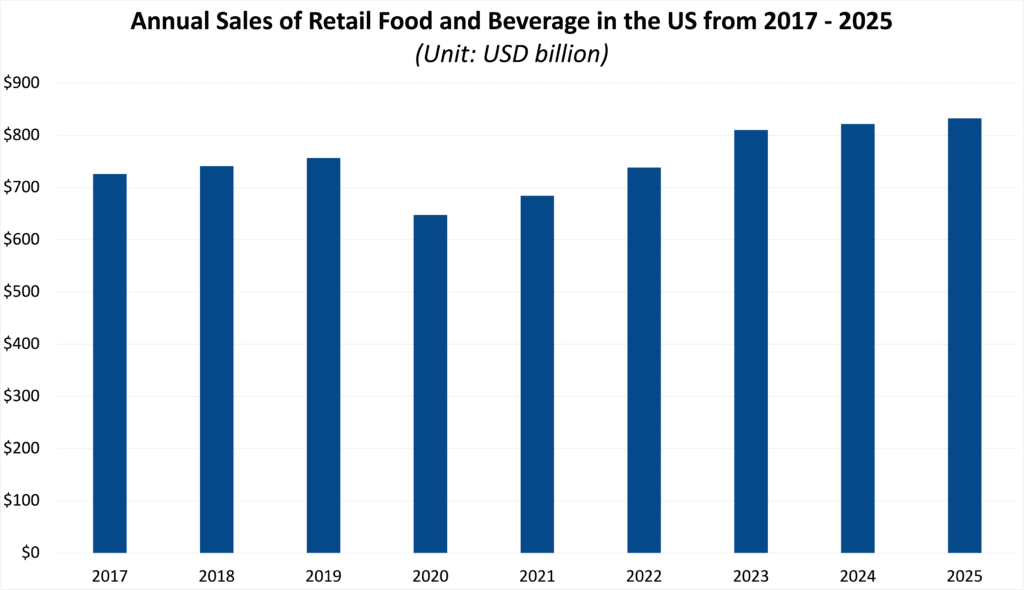
Figure 1
Furthermore, Food & Beverage sales continue to move online, a traditional bedrock for brick-and-mortar retail. Food & Beverage sales in the U.S. accounted for 13.11% of total e-commerce retail sales in 2021, and are projected to grow to 21.16% of total e-commerce retail sales by 2025. These changes in the Food & Beverage industry provide opportunities for agile businesses to capture growth in specialized and differentiated food markets.
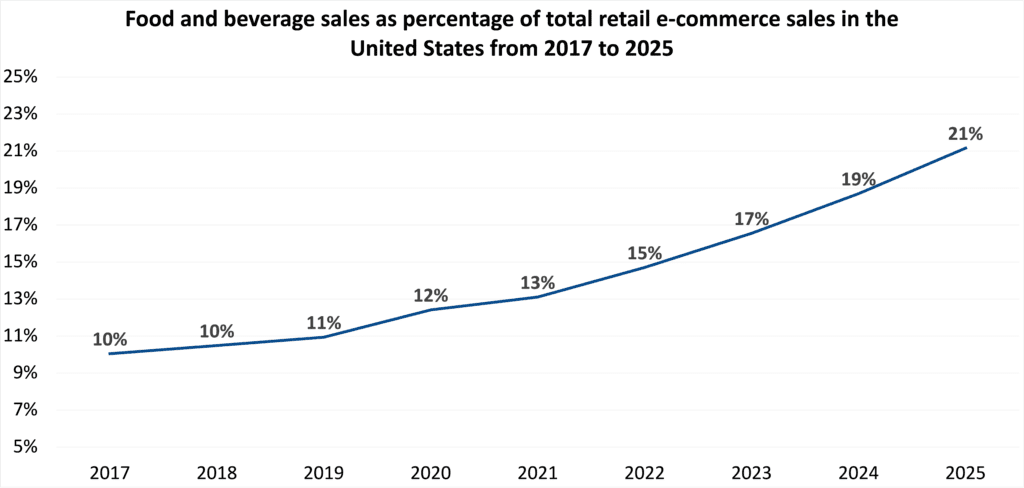
Figure 2
(1)
Growing Healthy Food Markets Bolster Industry Growth
The next-generation plant-based meat, egg, and dairy products are increasingly competitive to animal products with key drivers of consumer choice: taste, price, and accessibility.
Dollar sales of plant-based foods grew 40% in 2020 and 79% over the period from 2017 to 2020. (2)
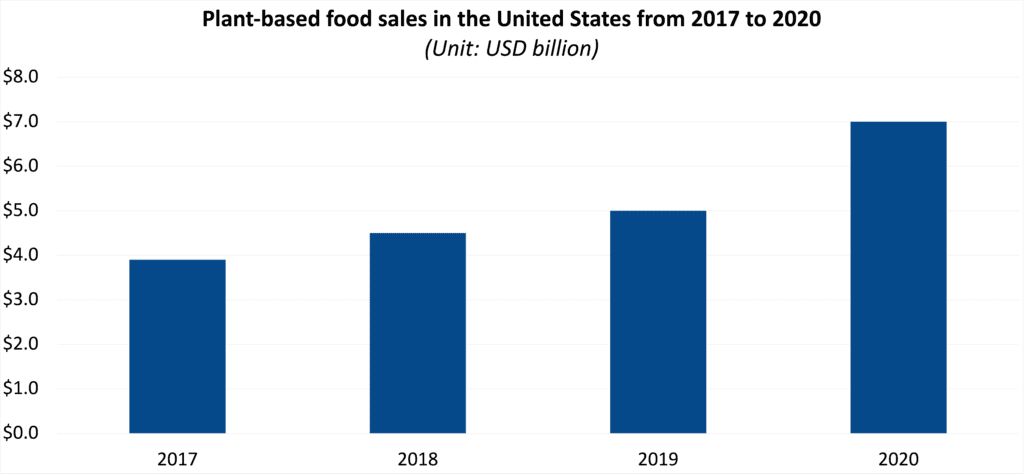
Figure 3
Though consumer lifestyles still demand time-saving and convenient products, traditional “junk foods”, such as soft drinks, are falling behind convenient alternatives like meal replacement products. Nevertheless, the industry has rapidly adjusted to changing tides, by unveiling options focused on health to shore up their image, undergoing a sector-wide adjustment in fast food marketing and product offerings (you can now get a kale salad at McDonald’s). Though the actual health benefits of such menu items may be uncertain, the message is clear: the industry is responding to the change in consumer values. (3)
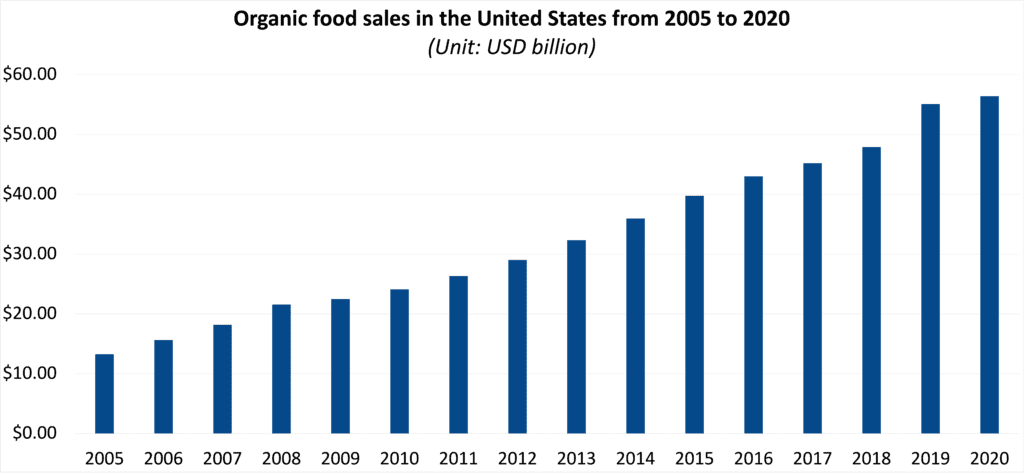
Figure 4
Coronavirus Impact on Food & Beverage Industry
Sales of alcoholic beverages in the U.S. kept increasing from the beginning of March to the end of April 2020. Weekly sales peaked on April 4th 2020, with a growth rate of 449% compared to the year 2019. Online shopping of alcoholic beverages increased more dramatically than in-store shopping due to the coronavirus breakout.
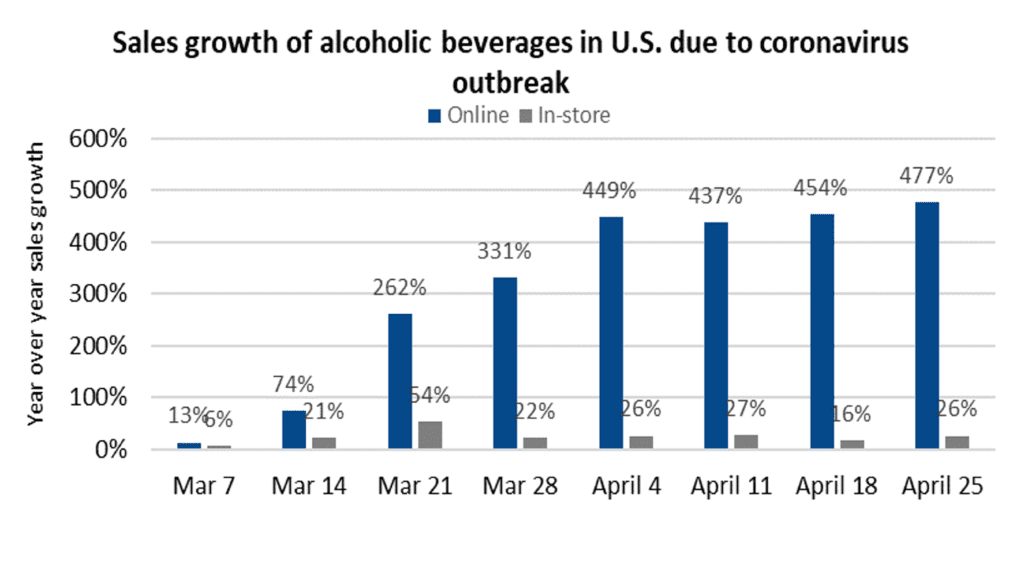 Figure 5
During the coronavirus outbreak in March and April 2020 U.S. sales of plant-based food increased radically compared to sales in 2019. During peak panic, sales of refrigerated plant-based meat increased 241%, plant-based meat increased 148%, plant-based cheese increased 95%, tofu and tempeh increased 88% compared to the same period in 2019. Four weeks post peak buying, sales of plant-based food dropped around 50% compared to peak panic buying sales. (4)
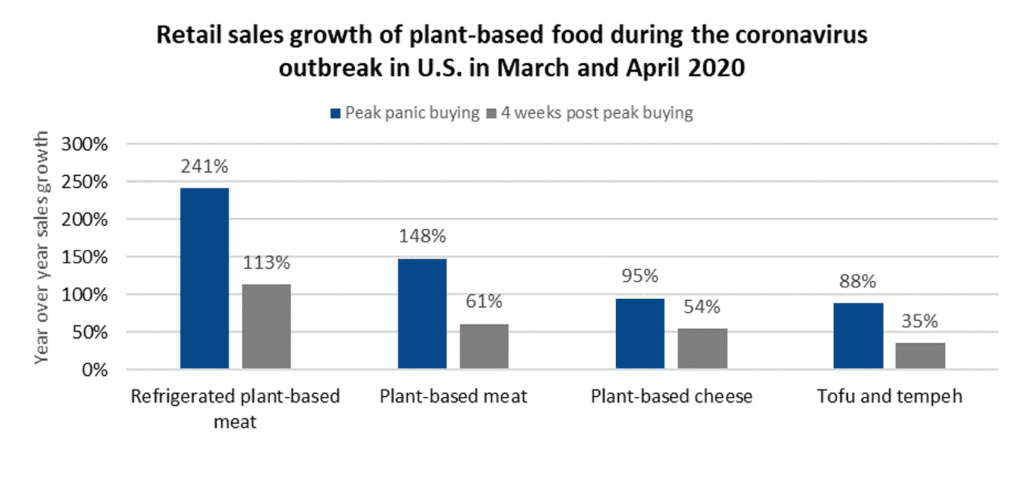 Figure 6
Mergers and Acquisitions Outlook
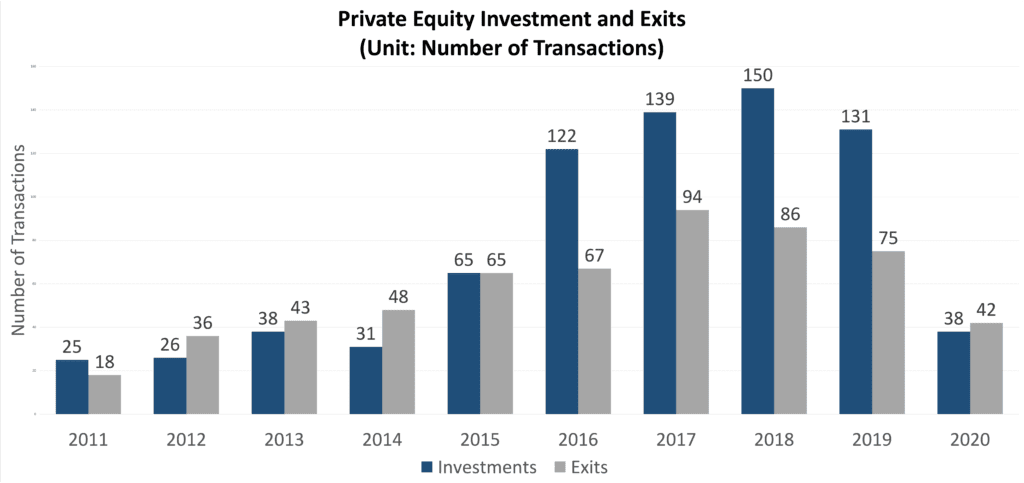
Figure 7
In 2020 there was a 61% decrease in M&A activities. M&A Investments in the Food & Beverage Industry remains robust, and is expected to increase to more than 150 transactions in 2021.
Firms in this industry have been exposed to synergy opportunities through M&A, to capture additional growth from both economies of scale and scope.
![]()
Figure 8
The Number of Transactions and the Total Transaction Volume decreased in 2020, impacted from the Covid-19. M&A activity in the Food & Beverage sector is still predominately driven by strategic buyers (including companies primarily owned by private equity investors), with strategic transactions representing 93% of the total number of deals in 2020.
![]()
Figure 9
In the last few years, acquirers are willing to invest more in M&A acquisitions in the Food & Beverage industry. As shown in the graph, the median enterprise value/last twelve months EBITDA multiple reached 1.6x, which is the highest multiple during the last decade. The enterprise value/last twelve-month sales multiple remains relatively stable during the last four years which was 1.4x in 2021. While the multiples have been generally increasing, it should be noted that the current market conditions and current low interest rates have had a significant impact on multiples in every industry due to these conditions. (5)
References
(1) Statista. (2021, December). Retail: Food & Beverages. Retrieved from https://www.statista.com/study/15813/retail-food-and-beverages-in-the-us/
(2) Statista. (2020, December). Value of the plant-based foods market in the United States from 2017 to 2020. Retrieved from https://www.statista.com/statistics/1070603/plant-based-food-market-size-in-the-us/
(3) Statista. (2022, January). Organic food sales in the United States from 2005 to 2020. Retrieved from https://www.statista.com/statistics/196952/organic-food-sales-in-the-us-since-2000/
(4) Statista. (2019, April). Coronavirus: impact on Food & Beverage trends in the. Retrieved from https://www.statista.com/study/73968/coronavirus-impact-on-food-and-beverage-trends-in-the-us/
(5) HarrisWilliams. (2021, December). Food & Beverage. Retrieved from https://www.harriswilliams.com/de/system/files/industry_update/consumer_food_-_beverage_quarterly_industry_update_q4_2021_v5_11.9.21_sc.pdf